Create FISH-quant [Matlab] outline files
In order to use the segmentation results in the Matlab version of FISH-quant, FISH-quant outline files have to be created from the mask images.
For this, we provide a Matlab GUI distributed with the FISH-quant package. After installing FISH-quant, you can open this GUI from the command window
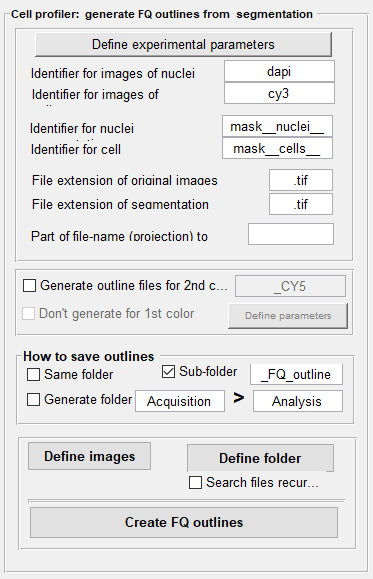
with FQ_seg. The relevant part of the interface is the central panel Cell Profiler: generate FQ outlines from segmentation.

-
Specify experimental parameters. These parameters have to be defined – even if the default parameters are good. Only then the button to generate the outlines will be enabled.
-
Define naming scheme of original images and segmentation results. You have to define a few parameters regarding the naming convention of your files.
- Unique identifier for the FISH and DAPI images. These identifiers have to be defined in a way that when you take the
full file-name of the FISH image and you replace the identifier for FISH, e.g.
cy3, by the identifier of the DAPI, e.g.dapi, you obtain the DAPI file-name. - Then, you have to define the identifier of your segmentation results. For this workflow,
mask__nuclei__for the nuclei andmask__cells__for the cells. - File-extensions of the masks and original file-names, e.g.
tiffor the example data.
- Unique identifier for the FISH and DAPI images. These identifiers have to be defined in a way that when you take the
full file-name of the FISH image and you replace the identifier for FISH, e.g.
-
[Optional] Generating outline files for a second color. This option allows to generate outline files for a second color, e.g. for a dual-color FISH experiment or if the cell segmentation was performed with a different channel than the FISH channel. The outlines for this color will be based on the segmentation results of the first color and the exact cells will be used. This allows a simple comparison between the detection results. As above, the identifier for the second color has to be specified, e.g.
cy5. You also have to redefine the experimental parameters (most often to adjust the excitation and emission wavelength).Additionally, you can choose to not create the outlines for the channel that was used for cell segmentation. This option is useful if the first color does not contain actual smFISH data but results of a dedicated cell segmentation stain.
-
Several options exist to specify the folder where the results will be saved. By default, the FQ outlines will be stored in a sub-folder
__FQ_outlineswithin the folder containing the segmentation results. You can then move it to another location, e.g. directly into theanalysisfolder as done for the example data. -
Specify images that will be analyzed. You can either choose different images that you want to analyze (
Define images), or select an entire folder (Select folder). For the latter, you can also specify a recursive search; this means that all subfolders will be searched as well (not recommended for this workflow). The script will only consider images that follow the above explained naming convention – other images will be ignored. In the example data, the folderanalysis\segmentation-resultscontains the relevant data. -
Create outlines. Lastly, press the button
Create FQ outlines. The script will then automatically search for the files describing the segmentation of cells and nuclei. For each image an outline file with the reference to the ORIGINAL 3D image will be generated and nuclei assigned to their respective cells.